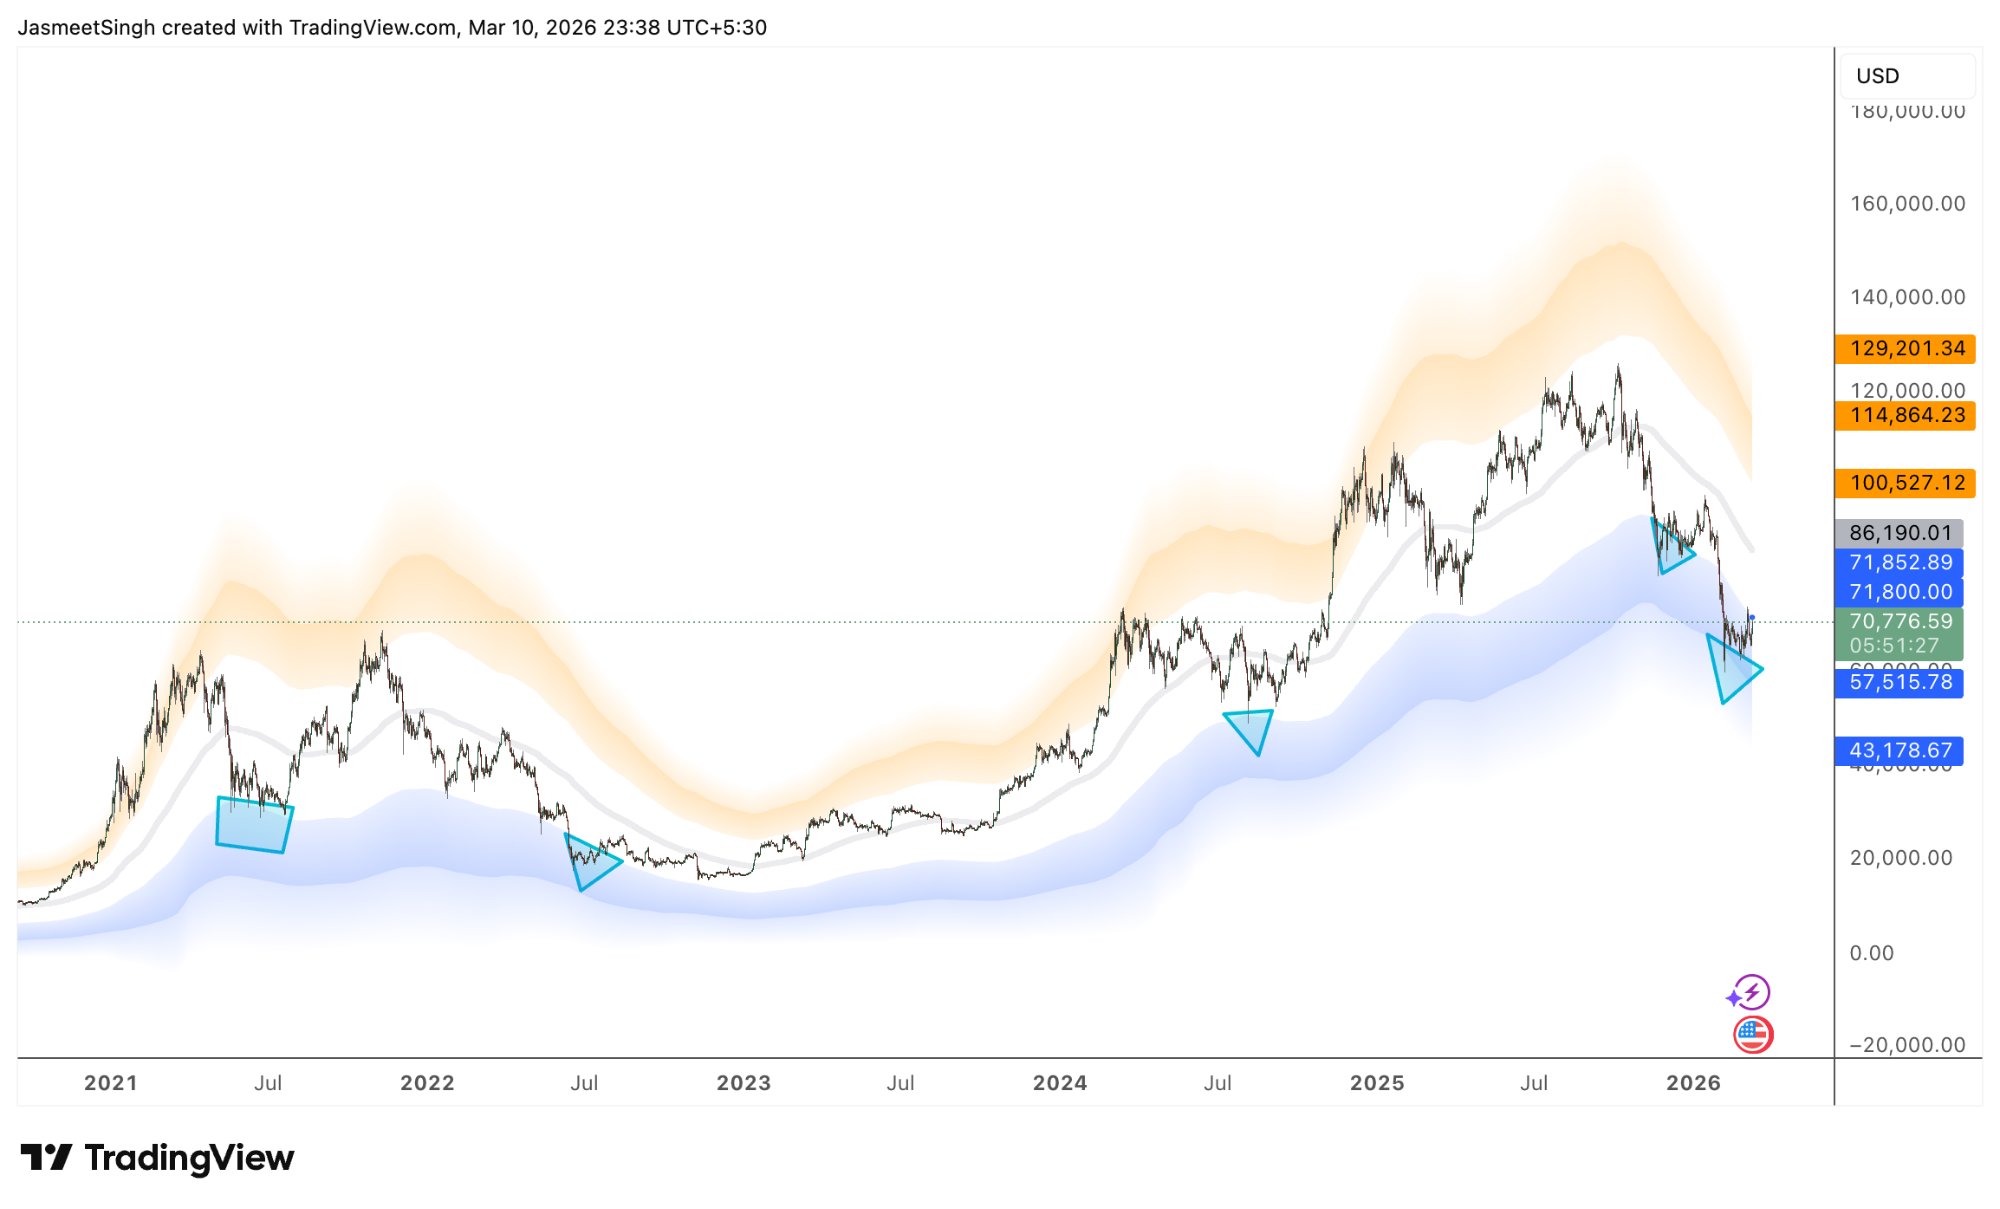
Module 1 — The Blue Zone Blueprint | Cassia Trading
MODULE 1
The Blue Zone Blueprint
STRATEGY MODULE
📡 DEVIATION BAND STRATEGY · 2026 EDITION
THE BLUE ZONE BLUEPRINT
How to buy Bitcoin, Stocks & ETFs when they are statistically cheap — using math, not emotion.
FEATURED ASSETS ANALYSIS
Bitcoin
Digital Store of Value
📈
S&P 500
SPY Market Index
🔷
QQQ / ZEB
Nasdaq & Canadian Banks
Ξ
Ethereum
Smart Contracts
CURRENT ZONE
Deep Value
2.1σ Below Trend
BUY +2σ ORANGE ZONE −2σ BLUE ZONE 200-DAY WMA
MODULE 1
Why We Buy High & Sell Low
⚠ CRITICAL ERROR
WHY WE BUY HIGH
AND SELL LOW

Without a map, investors navigate by emotion. This leads to maximum exposure at peaks and capitulation at bottoms.

🧠
Emotional Extremes
FOMO drives buying at peaks (Euphoria). Fear forces selling when assets are cheapest (Panic).
📰
Headline Bias
Positive news peaks when risk is highest. Negative headlines dominate the best buying windows.
⚖️
No Objective Rules
Subjective decisions → inconsistent results → deep drawdowns. Math removes the guesswork.
🔵
If We're Looking For Value...
We need to buy when everyone is scared — when assets are statistically cheap, not when headlines say "all-time highs." The Blue Zone gives us that signal.
THE SOLUTION NEEDED
A visual, data-driven signal that tells you: "This asset is statistically cheap right now. Buy."
THE CYCLE OF EMOTIONS
HOVER THE DOTS TO EXPLORE
200-DAY AVG ORANGE ZONE — OVERVALUED BLUE ZONE — UNDERVALUED PEAK — BUY FOMO HERE CROWD BUYS — MAX RISK 🔴 📤 PLANNED SELL ZONE Take profit when price is +2σ above BOTTOM — MAX OPPORTUNITY CROWD SELLS — BEST BUY 🔵 ✅ BUY FROM THIS LEVEL Price < Trend − 2σ → Enter DCA Hope Optimism EUPHORIA ↑ Anxiety PANIC ↓ Recovery
MODULE 1
The Value Hunter Mindset
IF WE'RE LOOKING FOR VALUE...
THE VALUE HUNTER MINDSET

True value investors do the opposite of the crowd. They buy fear and sell greed. The Blue Zone is the statistical proof that fear is present.

❌ The Crowd Buys...
All-Time Highs
"BTC hits $68K! I need to get in!"
After +50% Run-ups
"SPY is up so much — this must be the new normal."
When Everyone's Excited
"My cousin made 3x — I should buy too."
RESULT: Buy overvalued → lose money
✅ Value Hunter Buys...
Deep Discounts (−2σ)
"BTC is 2 standard deviations below trend. That's rare."
Maximum Fear Events
"COVID crash, 2022 bear — these are GIFTS."
When Headlines Are Worst
"CNBC says crash. My indicator says Blue Zone. Buy."
RESULT: Buy undervalued → massive gains
🔵 The Signal That Tells You
PRICE < (TREND − 2σ)
Asset is in the bottom 2.5% of its historical range
Price is statistically cheap
Mean reversion is highly probable
Math says: THIS IS YOUR ENTRY
"Be greedy when others are fearful." — Warren Buffett
The Blue Zone is that moment, quantified.
MODULE 1
The Blue Zone Concept
THE FRAMEWORK
THE BLUE ZONE CONCEPT
A singular objective framework that removes emotion by defining value through statistical deviation.
🛒
BLUE ZONE
OPPORTUNITY AREA
WHAT IS IT?

Price action located statistically below the long-term trend (200-day moving average). Represents periods of capitulation or undervaluation.

INVESTOR MINDSET
Rational Accumulation Value Seeking Contrarian
TrendPrice
Price < Trend (−1σ to −2σ)
ACTION: Scale-In / Buy
ORANGE ZONE
CAUTION AREA
WHAT IS IT?

Price action extended statistically above the long-term trend. Represents periods of euphoria, FOMO, or overvaluation.

INVESTOR MINDSET
Patience Discipline Risk Management
TrendPrice
Price > Trend (+1σ to +2σ)
🚫ACTION: Hold / Trim / Avoid
✓ WORKS ON STOCKS ✓ WORKS ON CRYPTO ✓ WORKS ON ETFS
MODULE 1
How the Blue Zone Works
NO MATH DEGREE REQUIRED
HOW IT WORKS
THE SETUP — 5 STEPS
1

Pick Any Liquid Asset

Bitcoin, SPY, QQQ, ZEB — any asset with at least 2 years of price history and daily volume.

2

Plot the 200-Day WMA

This is your "center line" — the long-term trend. Everything is measured relative to this line.

Basis: 200-period WMA (daily)
3

Measure Standard Deviation

σ = how far price typically swings from the average. 95% of all price action lives within ±2σ.

4

Draw Bands at ±2σ

Upper band = +2σ (Orange Zone). Lower band = −2σ (Blue Zone).

Upper: +2σ · Lower: −2σ
5

Blue Zone Appears!

Price breaks BELOW the −2σ band → it's in the bottom 2.5% of its historical range → statistically oversold.

ORANGE ZONE (+2σ) CAUTION — EXPENSIVE 200-DAY WMA (CENTER) BLUE ZONE (−2σ) OPPORTUNITY — CHEAP BUY BUY ZONE
DEVIATION BANDS — DAILY CHART
💡 KEY INSIGHT

You don't need to calculate anything. TradingView plots deviation bands automatically. You just need to wait for the blue zone, then execute your plan.

95%
OF PRICE ACTION
STAYS WITHIN ±2σ
1-2×
BLUE ZONES PER YEAR
PER ASSET (TYPICAL)
MODULE 1
Bitcoin — Blue Zone Analysis
₿ BTC / USD·
3 BLUE ZONES · 2020–2026
BITCOIN TREASURE HUNTS
🔵 BLUE ZONE #1 · EARLY 2021
BTC at ~$30,000
Entry price~$30,000
$10,000 invested→ Later hit $68K
Return+126% · became $22,600
🔵 BLUE ZONE #2 · MID 2022
BTC at ~$19,000 — Everyone Panicking
Entry price~$19,000
$10,000 invested→ Later hit $73K
Return+284% · became $38,400 🏆
🔵 BLUE ZONE #3 · 2026 (NOW)
BTC Re-entering Blue Zone
Current level~$70,776
Zone depth−2.1σ Below Trend
History saysActive buying opportunity 🔵
🎯 THE PATTERN

Blue Zones appear 1-2× per year. Each time = a generational entry. Hold 2+ years minimum.

+284%
BEST ZONE RETURN (2022)
See the chart on the next slide →
BTC DEVIATION BANDS
MODULE 1
BTC / USD — Deviation Bands
BTC / USD
BTC / USD
Bitcoin Deviation Bands
200-DAY WMA · ±2σ BANDS
ZONE LEGEND
Blue Zone
Opportunity / Cheap
Orange Zone
Caution / Expensive
MODULE 1
SPY & QQQ — Blue Zone Analysis
📈 S&P 500 · NASDAQ 100 ·
SPY S&P 500 ETF
5 BLUE ZONES · 2018–2025
+116%
Avg return across all zones
$320
Avg buy price (all zones)
CONFIRMED BLUE ZONES:
🔵 Dec 2018 Market CrashConfirmed ✓
🔵 Mar 2020 COVID Crash+116% ✓
🔵 Jun–Oct 2022 Bear MarketConfirmed ✓
🔵 2025 DipRecent ✓
Chart on next slide →
QQQ Nasdaq 100 ETF
3+ BLUE ZONES
+133%
Avg return across zones
$263
Avg buy price
CONFIRMED BLUE ZONES:
🔵 Mar 2020 COVIDConfirmed ✓
🔵 2022 Bear Market (2 entries)+133% ✓
🔵 2025 DipRecent ✓
🎯 KEY INSIGHT

Blue Zones = scary headlines. That's when you execute your plan. Charts on next 2 slides →

MODULE 1
SPY / USD — Deviation Bands
SPY / USD
SPY / USD
S&P 500 Deviation Bands
200-DAY WMA · ±2σ BANDS
ZONE LEGEND
Blue Zone
Opportunity / Cheap
Orange Zone
Caution / Expensive
MODULE 1
QQQ / USD — Deviation Bands
QQQ / USD
QQQ / USD
Nasdaq 100 Deviation Bands
200-DAY WMA · ±2σ BANDS
ZONE LEGEND
Blue Zone
Opportunity / Cheap
Orange Zone
Caution / Expensive
MODULE 1
ZEB — Canadian Banks ETF Analysis
🍁 ZEB · BIG 6 CANADIAN BANKS · CASSIA
CANADIAN BANKS ETF · 3 BLUE ZONES · 7 YEARS
ZEB — PATIENT ACCUMULATION
+114%
Price gain (3 zones)
+16%
4 years dividends
~130%
Total combined
🟢 ZONE #1 · MARCH 2020 — COVID CRASH
ZEB crashed to $22 CAD
Buy$22.00 CAD
2021 recovery$36.00 (+63%)
Plus dividends~4% annually 💰
🔵 ZONES #2 & #3 · 2022–2024
ZEB at $31–$32 CAD
Avg cost (all 3 zones)$28.33 CAD
Current ZEB price~$60+ CAD
Total gain~130% including dividends 🏆
🍁 CANADIAN ADVANTAGE
ZEB pays ~4% annual dividends while you wait for the next Blue Zone. You earn income being patient.
Holds RBC, TD, BMO, Scotiabank, CIBC, National Bank — the backbone of Canadian finance.
Put in your TFSA = 100% tax-free dividends and capital gains. No tax drag.
Canadian banks are oligopolistic — government regulated, can't fail easily. Perfect for patient accumulation.
💡 BEST USE CASE

ZEB Blue Zone entry + TFSA + DRIP = Maximum compounding with zero tax. The perfect Canadian long-term hold. Chart on next slide →

MODULE 1
ZEB / CAD — Deviation Bands
ZEB / CAD
ZEB / CAD
Canadian Banks Deviation Bands
200-DAY WMA · ±2σ BANDS
ZONE LEGEND
Blue Zone
Opportunity / Cheap
Orange Zone
Caution / Expensive
MODULE 1
Ethereum — Blue Zone Analysis
Ξ ETH / USD·
4 BLUE ZONES · 2021–2026
ETHEREUM BLUE ZONES
🔵 ZONE #1 · MID 2022
ETH at ~$900 — Post Luna Crash
Entry~$900
Previous ATH~$4,900
Zone to ATH potential+444%
🔵 ZONES #2 & #3 · 2024–2025
Multiple re-entries
2024 zone entry~$2,000
2025 zone entry~$1,800
Consistent patternRepeated successfully
🔵 ZONE #4 · 2026 (NOW)
ETH Active Blue Zone
Current~$2,065
Blue zone floor~$1,618
StatusActive — accumulate DCA 🔵
⚠️ RISK WARNING

ETH is more volatile than SPY/ZEB. Expect 40–70% drawdowns inside Blue Zone. Only allocate what you can hold through extreme volatility.

+444%
BEST ZONE RETURN (2022→ATH)
Chart on next slide →
MODULE 1
ETH / USD — Deviation Bands
ETH / USD
ETH / USD
Ethereum Deviation Bands
200-DAY WMA · ±2σ BANDS
ZONE LEGEND
Blue Zone
Opportunity / Cheap
Orange Zone
Caution / Expensive
MODULE 1
The Blue Zone Rules
YOUR BUYING PLAYBOOK
THE 5 RULES
1

Only Buy IN the Blue Zone

If price is above the −2σ band → Do NOT buy. Wait. Be patient. The Blue Zone WILL come. Impatience costs money.

2

Use Dollar-Cost Averaging (DCA)

Don't deploy all cash at once. Spread buys over 1-2 weeks: 25% → wait → 25% → wait → 25% → 25%. Price may drop further into the zone.

3

Have a Pre-Planned Budget

Decide BEFORE the Blue Zone appears: "When BTC hits the zone, I'll deploy $X." Don't scramble to find cash when the opportunity comes.

4

Hold Long-Term (2+ Years)

Blue Zone = entry signal, NOT a trading signal. Buy in the zone → hold for 2+ years minimum. Let the statistical mean-reversion work for you.

5

Don't Sell in the Orange Zone

When price hits +2σ (top band) → you might be tempted to sell. DON'T. That's where the big gains compound. Sell only if fundamentals change permanently.

✅ THE COMPLETE PLAYBOOK
Wait → Price enters Blue Zone
DCA in over 1-2 weeks
Hold 2+ years minimum
Repeat next Blue Zone
MODULE 1
How to Set This Up
5-MINUTE SETUP
SET UP IN 5 MINUTES
💻

Step 1 — Open Charting Software

Use TradingView (free) — the best platform for deviation band indicators. Wealthsimple and IBKR also supported.

tradingview.com → free account
🔍

Step 2 — Add the Indicator

Search for "Deviation Bands" or "Standard Deviation Bands" in the indicator library.

Indicators → "Deviation Bands"
⚙️

Step 3 — Set the Parameters

Basis: 200-period WMA · Upper: +2σ · Lower: −2σ · Timeframe: Daily chart

200 WMA · ±2σ · Daily
🎨

Step 4 — Color the Zones

Lower band area (below −2σ): Cyan/Blue. Upper band (above +2σ): Orange. Center line: Gray.

🔔

Step 5 — Set Alerts (Optional but Powerful)

Most platforms let you set alerts when price enters the Blue Zone. Get a phone notification. Never miss an opportunity.

Alert → "Price crosses below −2σ"
ASSETS TO TRACK
Bitcoin (BTC)
High Volatility
ΞEthereum (ETH)
High Volatility
📈SPY — S&P 500
Lower Volatility
📊QQQ — Nasdaq 100
Medium Volatility
🍁ZEB — Canadian Banks
+ Dividends
🎯 DONE! NOW JUST WAIT.

Setup takes 5 minutes. Then you wait for the Blue Zone to appear. Could be next week, could be 6 months. When it does → execute your plan.

MODULE 1
Common Mistakes — Don't Do These
CRITICAL ERRORS TO AVOID
COMMON MISTAKES

Buying BEFORE the Blue Zone

"It's close to the Blue Zone, I'll buy now." NO. Wait for price to actually ENTER the zone. Impatience costs you money every time.

Selling When Price Exits the Zone

Blue Zone is an ENTRY signal, not an exit signal. You hold for years, not weeks. Exiting early is the #1 way to miss the big gains.

Going All-In on Day 1

Use DCA. Spread your buys over 1-2 weeks. Price might drop further into the Blue Zone. This protects you from premature entry.

Using on Low-Volume / Sketchy Assets

Blue Zones work on LIQUID, quality assets only. ✅ BTC, ETH, SPY, QQQ, ZEB. ❌ Random penny stocks, meme coins, low-volume junk.

Checking the Chart Every Hour

Set alerts. Live your life. Blue Zones are rare (1-2 per year per asset). You don't need to stare at charts all day — that creates anxiety, not profit.

Panic Selling INSIDE the Blue Zone

"It's dropping more! I need to sell!" NO. The Blue Zone means it's CHEAP — that's GOOD. If you can't handle 20-30% drawdowns, you need a smaller position size.

✅ THE CORRECT APPROACH

Wait → Enter zone → DCA in slowly → Hold for 2+ years → Let math work. Simple. Disciplined. Profitable.

MODULE 1
Action Items — Do This Week
📜 ACTIVE QUESTS
YOUR ACTION PLAN

Set up deviation bands on your charts

5 minutes. TradingView or your broker. Settings: 200-period WMA, ±2σ, daily.

+50 XP

Pick 2-3 assets to track

Choose from: BTC, SPY, QQQ, ZEB, ETH. Add them to a watchlist.

+30 XP

Set up alerts for Blue Zone entry

Phone notification when price crosses below −2σ band. Never miss the window.

+40 XP

Decide your budget per asset

"When BTC hits zone → $2,000. When SPY → $5,000." Write it down. Make it real.

+60 XP

Set aside cash reserves now

Keep 10-20% of your portfolio in cash as Blue Zone ammunition.

+100 XP

Review past Blue Zones (back 5 years)

See where zones appeared, calculate historical returns. Builds strategy confidence.

+70 XP
QUEST PROGRESS
80% Complete — Almost There!
🏆
ACHIEVEMENT UNLOCKED
"Blue Zone Hunter"
First alert triggered!
NEXT QUEST
🔵
Wait for the Blue Zone
Estimated time: 6-12 months
⭐ EASY +500 XP on first buy
🎯 REMEMBER

Blue Zones are rare. You might wait 6-12 months for the next one. That's okay. Patience is your superpower. When it appears → you'll be ready.

MODULE 1
Module Summary — Blue Zone Blueprint
WHAT YOU LEARNED
MODULE SUMMARY
🎯
The Blue Zone

Price below −2σ = statistically cheap = buying opportunity.

📊
5 Assets Covered

BTC, ETH, SPY, QQQ, ZEB — all confirmed the pattern.

📋
The 5 Rules

Wait for zone → DCA in → hold 2+ years → repeat.

⚠️
6 Mistakes

Impatience, early exits, all-in entries, and panic sells.

⚙️
Setup Guide

5-minute TradingView setup with alerts for blue zone entry.

🎯
3 Portfolios

Conservative, Balanced, and Aggressive allocation models.

🔵
MODULE COMPLETE
MODULE 1
COMPLETE
You now have a data-driven, emotion-free system to identify the statistically best times to buy any quality asset.
🔵 HUNT. BUY. HOLD. WIN.
COMING UP NEXT
M7
Module 7 — Advanced Position Sizing
How much to buy in each Blue Zone. Risk-adjusted allocation.